The Climate Finance Files
The gap between promises and payments
UCG / Getty Images
By Jorge Rivera, David McNair, and Miguel Haro Ruiz
Published
In 2009, rich countries promised developing countries that they would mobilise US$ 100 billion a year in climate finance by 2020. In 2024, a new goal of at least US$ 300 billion a year by 2035 was set, drawn from a wider range of sources.
According to official data, countries hit the US$ 100 billion goal three years in a row. That data mostly records promises to pay.
Data on actual payments exists, but it is spread across separate databases.
These numbers should be simple to find. They aren’t.
Until now.
In a new innovative method, ONE Data matched each promise to the payments made against it. We used statistical methods and AI tools to trace the lifecycle of a project from commitment to disbursement, then checked those matches against development banks’ own payment data and the International Aid Transparency Initiative.
What we found provides a new perspective on where climate finance is flowing.
In 2024, developed countries paid US$ 60.4 billion against the US$ 101.6 billion in public climate finance that the OECD reports.1
Of the US$ 60.4 billion, US$ 32.1 billion came directly from governments and EU institutions, US$ 26.8 billion from development banks like the World Bank, and US$ 1.6 billion from other international funds.
Key findings
- In 2024, developed countries paid US$ 60.4 billion against the US$ 101.6 billion in public climate finance recorded in official statistics. According to the OECD, the US$ 100 billion goal was met in 2022, 2023, and 2024. But that count mostly reflects commitments, not actual payments.
- In 2024, 64% of bilateral climate finance was provided by countries that have since cut, or plan to cut, their Official Development Assistance (ODA) budgets. This means that either climate finance is vulnerable to these cuts or other critical programmes could be cut to preserve climate finance.
- Eight countries, home to half the people living in extreme poverty, receive 25% of the climate finance paid to developing countries. Without India, the other seven, home to 43% of the people living on less than US$ 3 a day, receive just 11%.
- A single very large infrastructure project can outweigh a whole sector. One Indian high-speed railway accounted for more climate finance than all the climate finance recorded for off-grid solar and mini-grids in developing countries, combined.
- The World Bank paid 42% of the climate finance African countries received from 2021 to 2024. In 2026, the Bank dropped its 45% climate finance target.
Chapter 1
Why is it so hard to track climate finance?
In 2009, rich countries pledged at the UN climate talks to mobilise US$ 100 billion a year in climate finance by 2020. The idea was that the countries that did the most to cause climate change, through past and present emissions, should help the countries hit hardest by it.
Rich countries missed the target in 2020 and 2021, and it became a sore point in UN climate negotiations.
In 2024, the OECD reported that the goal had finally been met in 2022. Its latest figures indicate that the goal was also met in 2023 and 2024, based on data that mostly reflects commitments.
Climate finance is hard to track because the OECD’s data focuses on promised money, not money actually paid. Payments get recorded, but often as separate entries with no link to the promise. Four development banks, including the IFC, publish no project payments at all.
ONE Data developed an innovative methodology to connect disparate datasets to follow data on commitments through to disbursements.
Using Splink, an open-source tool built by the UK Ministry of Justice to link records across datasets on prison, court and parole records, ONE Data traced each project from the original promise to the payments made against it. It then checked those links against development banks’ own payment records and the International Aid Transparency Initiative, a public database of aid projects.
ONE Data also used AI to read the descriptions of more than 300,000 climate-marked project records and flag those that state no climate aim.2
Chapter 2
Where does the US$ 41 billion gap come from?
Our data shows that actual disbursements from developed countries amounted to US$ 60.4 billion of public climate finance.3
The chart below begins with the OECD’s headline figure and removes the money we cannot trace to a payment.
US$ 136.7 bn
The OECD’s headline figure for 2024 is US$ 136.7 billion.
−US$ 35.1 bn
About US$ 35 billion of that is export credits and private finance mobilised by public money, with no payment records, so we leave it out.
That leaves US$ 101.6 billion of public climate finance.
−US$ 11.9 bn
Next, the OECD counts US$ 11.9 billion more than providers’ own project records show, so we cannot trace it to payments and leave it out.
That leaves US$ 89.7 billion.
−US$ 29.2 bn
Lastly, donors committed US$ 29.2 billion more in 2024 than they disbursed.4
About half of that, US$ 13 to US$ 16 billion, is payments still to come, since commitments have grown over the past decade and most money is paid years after it is promised. The rest is mostly commitments not linked to any recorded payment, many of them tied to development banks.5
−US$ 76.3 bn
That leaves US$ 60.4 billion: the climate finance we can trace to payments.
Who paid it? US$ 32.1 billion, just over half, came directly from governments and EU institutions.
US$ 26.8 billion came from development banks like the World Bank.
And US$ 1.6 billion came from other international funds.
Notes and source
Notes: The OECD's total includes US$4.6 billion of export credits and US$30.5 billion of mobilised private finance.
Source: ONE Data analysis of OECD climate finance and Creditor Reporting System data. OECD figures from the OECD's May 2026 climate finance report.
So developed countries paid US$ 60.4 billion against the US$ 101.6 billion in public climate finance that the OECD counts, a gap of US$ 41 billion.
Commitments always run ahead of disbursements, given that money paid in a given year often settles promises made in previous years, and not every promise is paid in full. But reported finance has exceeded payments every year since 2020.
Notes and source
Notes: *As reported: the OECD's figures for public climate finance, which are mostly commitments, not payments. The dashed line adds export credits and mobilised private finance, the total the OECD counts against the US$100 billion goal.
Source: ONE Data analysis of OECD climate finance and Creditor Reporting System data. OECD figures from the OECD's May 2026 climate finance report. Current prices.
Chapter 3
The largest providers of climate finance are now cutting aid
Governments and EU institutions have paid the largest share of climate finance in recent years. Many of them are now cutting aid.
Much of climate finance is counted as ODA, and 64% of bilateral climate finance was provided by countries that have since cut, or plan to cut, their ODA budgets.6
Notes and source
Notes: Cutting aid: providers that have cut, or plan to cut, their aid: Austria, Belgium, Canada, Finland, France, Germany, the Netherlands, New Zealand, Sweden, Switzerland, the United Kingdom and the United States. EU Institutions count as a bilateral provider.
Source: ONE Data analysis of OECD climate finance and Creditor Reporting System data. Current prices.
This leaves climate finance vulnerable to cuts, or risks that other forms of development assistance could be cut to preserve climate finance.
Climate is also accounting for a growing share of aid. It made up one-fifth of rich countries’ bilateral aid in 2024, up from one-eighth in 2015, not counting aid to Ukraine or money spent inside donor countries. For France it was 37%, Germany 36%, and Japan 35%.
Notes and source
Notes: Both series are bilateral ODA disbursements only. Aid is gross bilateral ODA less in-donor refugee and administrative costs and less aid to Ukraine. Climate finance leaves out Ukraine too, and counts each project at its provider's own climate share. The share is 21.6% in 2024 and 12.7% in 2015.
Source: ONE Data analysis of OECD climate finance and Creditor Reporting System data. Current prices.
The mix of climate finance is shifting too. From 2021-2022 to 2023-2024, those three countries cut new adaptation commitments by 31% after inflation, while their mitigation commitments rose 37%, mostly because of Japanese lending in 2023.7
Part of the shift may reflect projects being labelled differently.
Chapter 4
The World Bank is a critical player in climate finance
From 2021 to 2024, the World Bank paid 42% of the climate finance African countries received. The money came through its two main lending arms: the International Development Association, which funds low-income countries, and the International Bank for Reconstruction and Development, which lends to middle-income countries. The World Bank’s climate finance to African countries averaged US$ 5.4 billion a year, more than four times what France, the next-largest provider, paid.
Notes and source
Notes: The World Bank is IDA plus IBRD. The African Development Bank includes the African Development Fund. African countries are the 54 African Union member states that are UN members.
Source: ONE Data analysis of OECD climate finance and Creditor Reporting System data. Current prices.
The World Bank provided more than half of all climate finance in 16 of 54 African countries. On 29 June 2026, the Bank dropped its target to spend 45% of its financing on climate. IDA’s climate target covers only its current funding round, which runs to 2028.
Notes and source
Notes: The World Bank is IDA plus IBRD. These 15 countries received 68% of the climate finance paid to the 54 African Union member states that are UN members.
Source: ONE Data analysis of OECD climate finance and Creditor Reporting System data. Current prices.
Loans are an increasingly important part of adaptation finance for the least developed countries. They represented 40% of the adaptation finance paid to least developed countries in 2024, up from 34% in 2020. Most of the loans are concessional (79% of money lent in 2024, down from 94% in 2020)8, but the Paris Agreement asks donors to consider the need for public and grant-based adaptation finance for these countries.
Chapter 5
Climate finance doesn’t always flow to countries most vulnerable to the effects of climate change
There are two main cases for where climate finance should go: to the countries most exposed to climate change and least able to adapt, or to countries like Indonesia and South Africa that are big emitters, to help them cut emissions.
From 2021 to 2024, half of the climate finance paid to named countries went to 14 countries. India alone received 13.7%.
Notes and source
Notes: Named countries only, which excludes regional and unallocated money.
Source: ONE Data analysis of OECD climate finance and Creditor Reporting System data. Current prices.
Half the people in developing countries living on less than US$ 3 a day live in eight countries, which receive just 25% of climate finance payments and 23% of adaptation finance.9 These countries are Nigeria (93 million people in extreme poverty), the Democratic Republic of Congo (87 million), India (74 million), Pakistan (51 million), Ethiopia (45 million), Tanzania (32 million), Yemen (27 million), and Mozambique (27 million). India alone receives more than half of that climate finance. The other seven, home to 43% of people living in extreme poverty, receive 11% of climate finance.
Notes and source
Notes: Extreme poverty is living on under US$3 a day at 2021 purchasing power parity, the mean of each country's 2021-2024 estimates. 149 recipient countries have poverty data. The others are left out of every bar.
Source: ONE Data analysis of OECD climate finance and Creditor Reporting System data. Current prices. Poverty from the World Bank's Poverty and Inequality Platform.
The COP28 Declaration on Climate, Relief, Recovery, and Peace called for more finance for fragile states. Yet, countries the OECD rates as highly or extremely fragile get little more than half as much climate finance as non-fragile developing countries of the same population.10
Notes and source
Notes: A value of 1 means a country gets what a typical developing country of its population receives. Above 1 it gets more, below 1 less. The fragile strip covers the 61 contexts of high or extreme fragility in the OECD's States of Fragility 2025, 18 of them extreme. Its median country gets 93% of what a typical developing country of its population receives, against 165% for the median non-fragile developing country.
Source: ONE Data analysis of OECD climate finance and Creditor Reporting System data. Current prices. Fragility from the OECD's States of Fragility 2025.
In fragile countries, one dollar in seven arrives via UN agencies and NGOs, compared with one in 33 elsewhere. Where donors suspended lending to governments after a coup or takeover, more of their climate finance went through NGOs.11
Chapter 6
What kinds of projects are funded?
Energy has moved up the climate agenda but the proportion of climate finance flowing to it has declined.
At COP28, countries pledged to triple renewable energy capacity by 2030, and in 2024 the World Bank and African Development Bank launched Mission 300 to connect 300 million Africans to electricity.
But energy’s share of new climate finance fell from 26% to 16% between 2015-2017 and 2022-2024, or from 29% to 21% counting policy loans coded to energy, which this analysis classifies as budget support.
Before inflation, climate commitments to named countries more than doubled, from US$ 33.0 billion a year in 2015-2017 to US$ 72.6 billion a year in 2022-2024, while climate finance for energy rose by only 34%, from US$ 8.6 billion to US$ 11.5 billion.
Notes and source
Notes: Commitments. The 26% and 16% are averages for 2015-2017 and 2022-2024. The single-year share is 26.1% in 2015 and 17.8% in 2024. Leaves out the providers that publish no project-level payments.
Source: ONE Data analysis of OECD climate finance and Creditor Reporting System data. Current prices.
A single very large infrastructure project can outweigh a whole sector.
One high-speed railway in India accounted for more climate finance than all the projects donors coded as off-grid solar and mini-grids in developing countries combined. From 2021 to 2024, loans from the Japan International Cooperation Agency, known as JICA, paid US$ 3.8 billion in climate finance for the Mumbai-Ahmedabad line. Over the same period, all of the projects that donors coded as off-grid solar or mini-grids received US$ 1.8 billion.12 Rail cuts emissions, so it counts as climate finance.
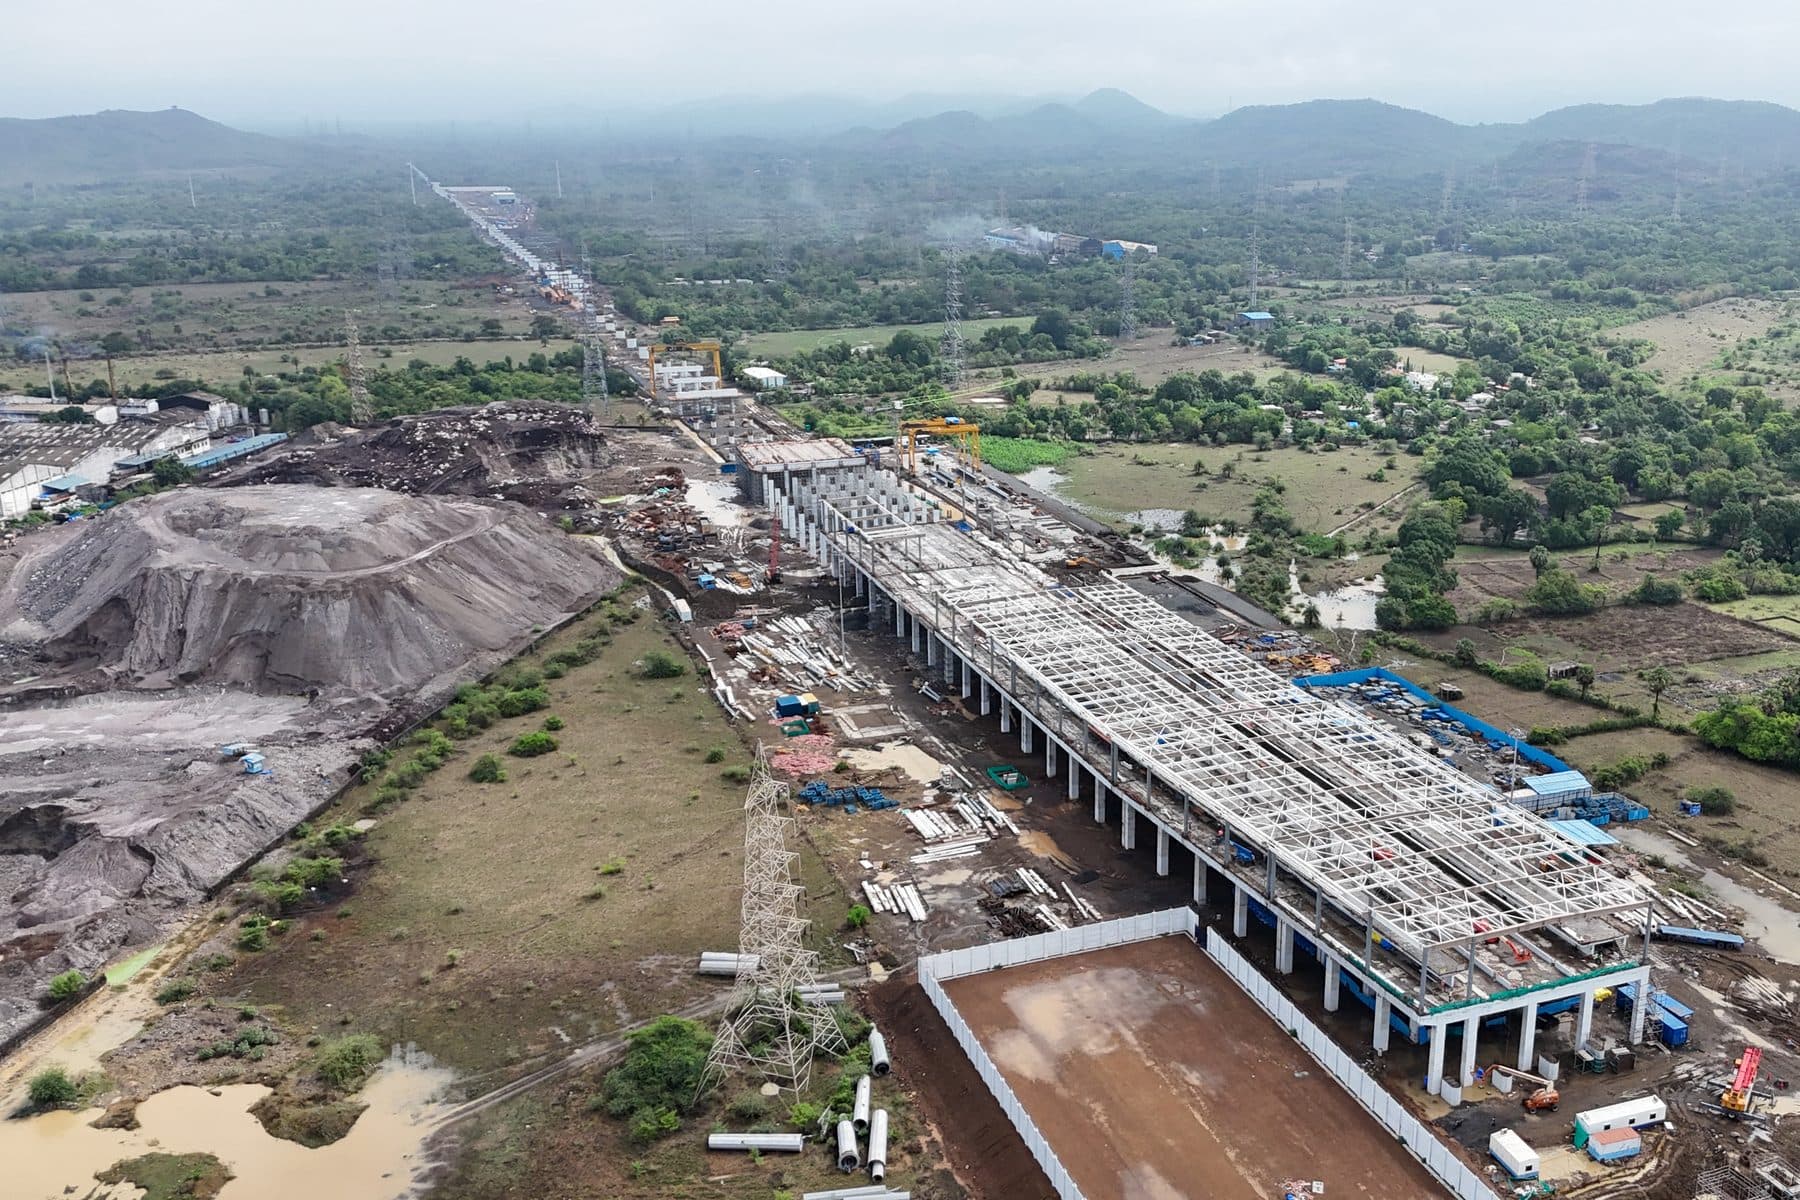
- Climate finance paid for the Mumbai-Ahmedabad high-speed railway, 2021-2024
- US$3.8bn
- Climate finance paid for off-grid solar and mini-grids in developing countries, 2021-2024
- US$1.8bn
In 2024, donors committed US$ 19.7 billion in aid marked for adaptation alone. For about half of that money, the project descriptions donors sent to the OECD made no mention of any adaptation aim.
ONE Data read donors’ own documents for the 40 largest of those projects, worth US$ 5.4 billion. Twenty-two of them, worth US$ 2.8 billion, describe no climate purpose at all. That’s at least 17% of the US$ 16.5 billion of adaptation-only aid that donors reported project by project for 2024.13
One is a US$ 636 million Korean-financed toll-road tunnel to Indonesia's new capital, which Korea’s own IATI record marks as having no adaptation aim.
What this means
Developing countries are planning around climate finance while carrying high debt and facing shrinking aid budgets. They need to know how much money will actually arrive. The official count doesn’t accurately tell them.
Tracking that properly means linking data on aid, development bank lending, and domestic spending in one place. This analysis shows how to better account for one piece of that puzzle: climate finance.
This is core to ONE Data’s mission. We are working to build the data infrastructure that underpins better and faster analysis to improve the quality of public finance decisions. The Development Finance Observatory, launched in October 2026, is a platform that seeks to bring AI driven tools to this challenge.
This analysis shows that a similar effort is needed for climate finance. A Climate Finance Observatory would link aid, development bank lending, and domestic spending in one place, so that governments, NGOs, and journalists can see where money is needed and where it actually goes. We welcome partnership and collaborations to help build this.
Methodology
How we traced the payments
How we linked commitments to payments, what counts as climate finance, and how we reach US$ 60.4 billion.
Read the methodology (opens in a new tab)Looking for our first edition? The Climate Finance Files 2023, published in November 2023.
Notes
-
The OECD counts US$ 136.7 billion towards the US$ 100 billion goal for 2024. That total adds export credits (US$ 4.6 billion) and private finance mobilised by public money (US$ 30.5 billion), neither of which has payment records, to the US$ 101.6 billion of public climate finance. The US$ 60.4 billion leaves out four development banks that publish no project-level payments. Including our estimate for them would raise it to about US$ 65 billion. Figures may not add to the total because of rounding. ↩
-
We tested our system on 5,200 adaptation-marked projects that researchers had checked by hand (Weikmans et al., 2017). It largely matched their judgements. ↩
-
Our figure counts projects at donors’ own climate shares, similar to OECD reporting. Four development banks, including the International Finance Corporation (IFC), publish no project-level payments. We estimate that including them would increase the figure to about US$ 65 billion. ↩
-
Of the US$ 29.2 billion, US$ 4.9 billion is commitments by the IFC and other banks that publish no project-level payments. ↩
-
We traced the 50 largest commitments from 2013-2019 with no linked payment (worth US$ 9.2 billion) through providers’ own records. About a fifth of that money had in fact been paid in full, under payment records that are not linked to the commitment, and 22% had been partly paid. Almost a fifth had been cancelled or never took effect, and 13% was still largely undrawn by the end of 2024. For the rest, records do not show what happened. ↩
-
Austria, Belgium, Canada, Finland, France, Germany, the Netherlands, New Zealand, Sweden, Switzerland, the United Kingdom, and the United States. The OECD listed all but Canada as members that had announced aid cuts for 2025-2027 (Cuts in official development assistance, June 2025). Canada's Budget 2025 cuts its international assistance by CA$ 2.7 billion over four years from 2026-27. ↩
-
Commitments by France, Germany, and Japan, annual averages for 2021-2022 and 2023-2024, in constant 2024 US dollars using each donor’s OECD deflator. Each project counts once, at the donor’s own climate share: as adaptation where its adaptation marker is the higher of its two Rio markers, as mitigation where its mitigation marker is higher, and as cross-cutting, left out of both, where the two are equal. Counted the OECD’s way, with a project marked for both aims counted in full under each, adaptation fell 15% and mitigation rose 25%. ↩
-
Loans here include other official flows, money lent on terms too close to market rates to count as aid. Concessional loans are those reported as official development assistance. ↩
-
Shares of the climate finance paid to the 149 countries with poverty data, which leaves out regional and unallocated programmes (18% of payments in 2021-2024). Poverty counts are World Bank estimates at US$ 3 a day, averaged over 2021-2024. ↩
-
The 61 contexts with high or extreme fragility in the OECD’s States of Fragility 2025. We compare each country’s climate finance received in 2021-2024 with what a developing country of the same population typically receives. The median country on the OECD’s list gets 93% of that typical amount, against 165% for the median non-fragile developing country, or 56% as much. ↩
-
Myanmar, Sudan, Mali, Burkina Faso and Niger, 2019-2024 disbursements, comparing the years before each coup with the years after it. The NGO share rose in each: in Myanmar from 7% to 21%, Mali 13% to 25%, Burkina Faso 11% to 19%, Niger 9% to 20%, and Sudan 9% to 35%. Afghanistan is left out because the CRS does not report the channel of its aid. ↩
-
Includes US$ 0.8 billion of policy loans. ↩
-
Donors here are the members of the OECD’s Development Assistance Committee, including Korea, which the rest of this paper does not count among developed countries. Without Korea the share is 15%. ↩
- Sources
- OECD, Climate Finance Provided and Mobilised by Developed Countries in 2013-2024 (2026); OECD Creditor Reporting System; OECD Climate-related Development Finance data; UNFCCC Biennial Transparency Reports; World Bank Finances One; Green Climate Fund Open Data Library; International Aid Transparency Initiative, for the African Development Bank, Asian Development Bank, Inter-American Development Bank, Islamic Development Bank, Central American Bank for Economic Integration, Global Environment Facility and others; World Bank Poverty and Inequality Platform; OECD, States of Fragility 2025; OECD, Cuts in official development assistance (2025); Government of Canada, Budget 2025; COP28 Declaration on Climate, Relief, Recovery and Peace; Paris Agreement; Weikmans et al. (2017); Toetzke, Stünzi and Egli (2022).
- Edited by
- Joe Kraus
- Additional support by
- Micaela Iveson, Morgan Martinez, Luca Picci, Phoenix Ricks, and Tilly Woodfield